Skip to content
Back Home

Experienced Writer with Data Specialization

Experienced Writer with Data Specialization

  • Home
  • Portfolio
  • Resume
  • About Me
Photo by Jachan DeVol
Home » Portfolio » Data Analysis » Olympic National Park: Data Visualizations

Olympic National Park: Data Visualizations

November 15, 2023  in Data Analysis  tagged Canva / data analysis / Tableau

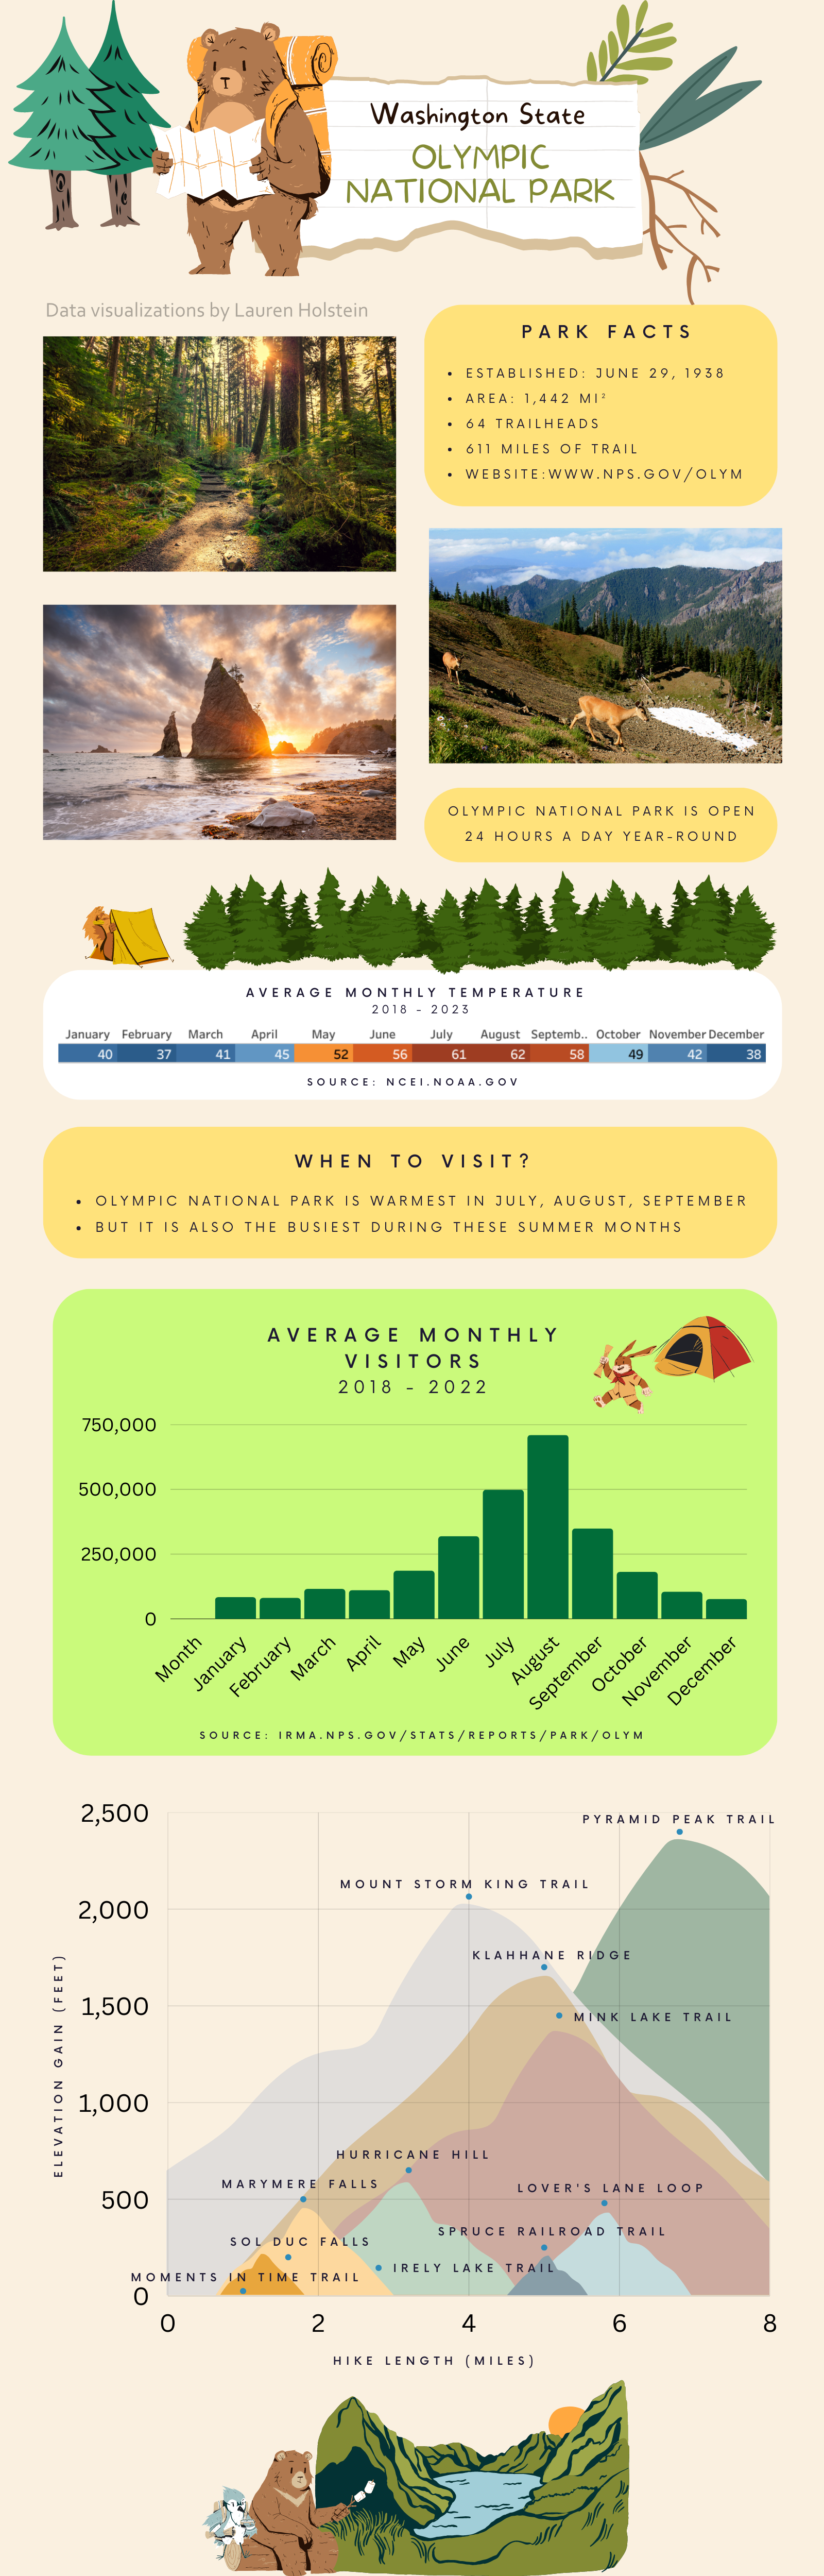
I made this brochure using Canva with data from the National Parks Service. The average monthly temperature viz was made in Tableau while all other charts were made in Canva.

Visualization showing various statistics about Olympic National Park.

Header photo by Jachan DeVol on Unsplash.


Post navigation

  • ← Data Analytics Case Study: Bellabeat Fitness Tracker
  • Python Data Project: Analyzing the App Stores →

· © 2025 Lauren Holstein · Powered by · Designed with the Customizr theme ·